Who Was Detained and Where Were They Confined?

By Emily Ryo, J.D., Ph.D. and Ian Peacock, M.A.
To understand whom ICE detained, we examined basic characteristics of the detainees such as gender, region of origin based on the country of citizenship, age at the time of first entry into ICE detention, legal status at the time of last entry into the United States (entry status), and whether or not they had been classified as an aggravated felon by ICE. Here, we focus on the following basic characteristics: gender, region of origin, and age.
To better understand the basic properties of all facilities used by ICE in fiscal year 2015, we examined the following key detention facility characteristics: (1) whether a given facility was operated by a for-profit company (Privately Operated), (2) whether a given facility was located outside of a major urban area (Outside MSA, as we describe in “Defining Facility Characteristics” below), and (3) distance to the nearest nonprofit immigration attorney who practice removal defense.
A majority of detainees were men, from Mexico or Central America, and about 17 percent of them were under the age of 18.
First, the detained population was heavily male—about 79 percent were men. Second, as shown in Figure 2, most detainees were from Mexico (43 percent) or the Northern Triangle region of Central America—El Salvador, Guatemala, and Honduras (46 percent). Together, these four countries constituted about 89 percent of the detainee population. The U.S. deportation regime has been called a “gendered racial removal program” that targets Latino men. Our findings call for systematic investigations into whether and how detention practices in particular might contribute to that dynamic.
Figure 2: Region of Origin of Detainees, Fiscal Year 2015
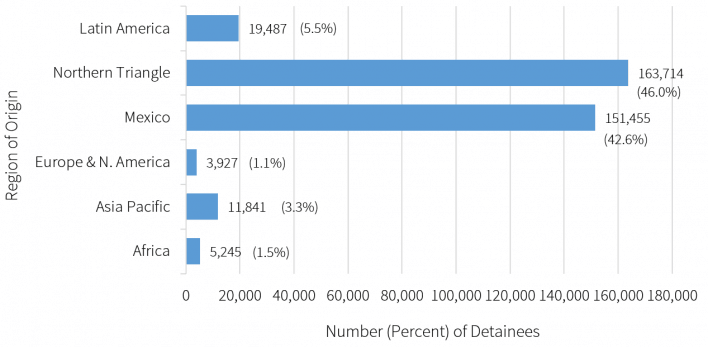
Source: Authors’ original analysis of the Detention Data.
The population as a whole was relatively young, with an average age of 28 (mean and median). As shown in Figure 3, over 59,00 detainees—about 17 percent of the detainees—were under the age of 18. Adults between the ages 18 to 30 made up the largest segment of the population (42 percent), followed by adults between the ages 31 to 40 (26 percent).
Figure 3. Age at Entry into Detention, Fiscal Year 2015
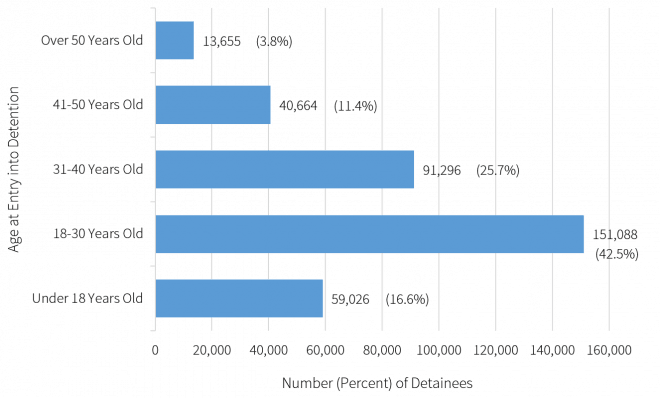
Source: Authors’ original analysis of the Detention Data.
Defining Detention Facilities
ICE uses the term “facility” in the Detention Data to refer to a range of locations that ICE used to detain individuals. Applying TRAC’s coding of detention facility types, we found that ICE used all of the following types of detention facilities during fiscal year 2015: (1) contract detention facilities, (2) holding/staging facilities, (3) ICE service processing centers, (4) facilities under intergovernmental service agreements with the federal government, (5) juvenile facilities, and (6) other facilities such as Federal Bureau of Prisons facilities, medical facilities, U.S. Marshals Service facilities, and motels or hotels.
The list of facilities that we analyze in this report is much broader than other lists of facilities that ICE has released in the past. This is because the other released lists include only those facilities that are authorized by the Detention Management Control Program (DMCP) and subject to DMCP inspections. The list of DMCP authorized facilities excludes many other facilities used by ICE for detention, such as temporary holding and/or processing facilities, Bureau of Prisons facilities, family or residential facilities, juvenile facilities, hospitals, hotels or motels, and short-term facilities.
All states had one or more facilities that ICE used to detain individuals, with Texas and California having the highest number of facilities and detainees.
In fiscal year 2015, ICE used 638 facilities to detain noncitizens, including juveniles. By far, the largest category—43 percent—were facilities with intergovernmental service agreements (IGSAs). IGSAs are agreements between the federal government and a state or local government to provide detention beds in jails, prisons, and other local or state government detention facilities. These facilities are government owned, but they may be operated by either local or state agencies or by for-profit companies.
As shown in Figure 4, every state in the United States had at least one immigration detention facility in FY 2015. Most of the facilities were located either in the South (39 percent) or the West (30 percent), followed by the Midwest (15 percent) and the Northeast (14 percent). The top five states in terms of the total number of facilities were: Texas (115 facilities), California (70 facilities), Florida (43 facilities), New York (39 facilities), and Arizona (33 facilities).
Figure 4. Number of Detention Facilities Used by ICE, Fiscal Year 2015
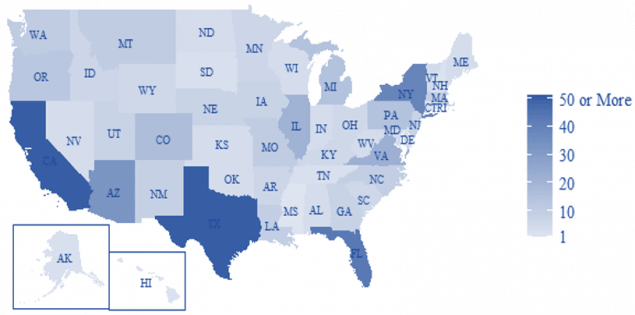
Note: U.S. territories of Guam, Puerto Rico, the Northern Mariana Islands, and the Virgin Islands are not shown, but each territory had at least one detention facility.
Source: Authors’ original analysis of the Geocoded Data.
Table 1 shows the top 15 states in terms of the total number of individuals detained in fiscal year 2015. By far, Texas had the highest number of detainees, followed by California, then Arizona. Interestingly, Arizona, Louisiana, and New Mexico had some of the highest levels of detainee populations in fiscal year 2015, yet they maintained relatively few facilities compared to Texas and California. Drilling down further to understand which counties and cities are likely to hold immigrant detainees will help us to better understand how federal-local partnerships in immigration enforcement might be shaping spatial patterns of immigration detention.
Table 1. Top 15 States by Detainee Population, Fiscal Year 2015
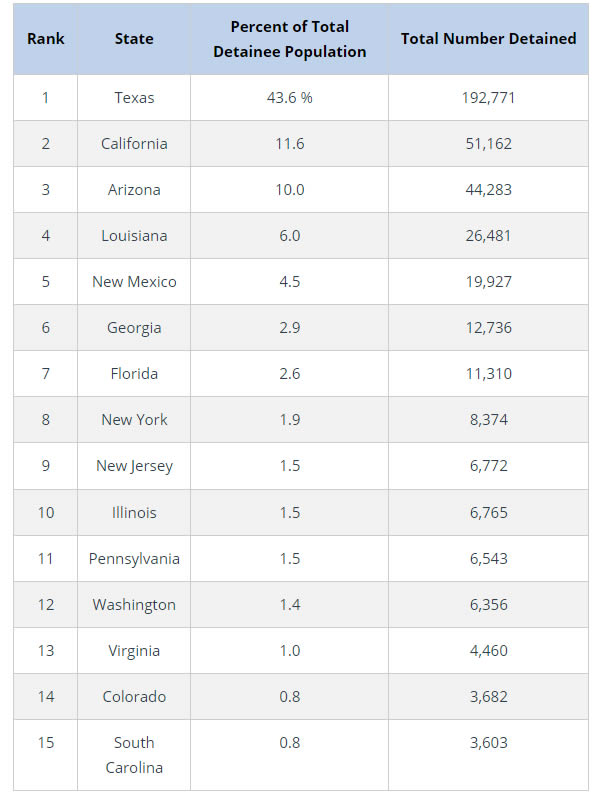
Source: Authors’ original analysis of the Detention Data.
Defining Facility Characteristics
Facilities are coded as privately operated if they were operated by non-governmental, for-profit correctional companies, such as the GEO Group, CoreCivic, and MTC Corrections. Publicly-owned facilities, such as county jails, may be privately operated.
Detention facilities located outside of the principal (largest) cities of metropolitan statistical areas (MSAs) are treated as placed outside of major urban areas. The U.S. Office of Management and Budget defines an MSA as consisting of “at least one urbanized area that has a population of at least 50,000.”
Each facility’s distance to the nearest nonprofit immigration attorney is measured by driving distance to the nearest immigration attorney who was an active member of the American Immigration Lawyers Association (AILA) in fiscal year 2015. Specifically, we focus on AILA attorneys who practice removal defense at legal services/nonprofit organizations or law schools.
This report provides portraits of detention facilities both at the facility level and at the detainee level. The estimates at the facility level indicate the percentage of facilities falling within a given category (for example, Privately Operated). The estimates at the detainee level indicate the percentage of detainees who were confined at least once in a facility falling within a given category. Detainee level analysis is different than the facility level analysis because some detainees moved in and out of various facilities during their detention due to interfacility transfers.
Detention in privately operated facilities and in remotely located facilities was common
According to a recent government report, 65 percent of the average daily detainee population as of September 2016 was confined in facilities operated by private, for-profit contractors. The expanding role of for-profit companies in the U.S. detention system has become a focal point of growing concern among advocates, scholars, and policymakers. Chief among these concerns is that certain issues may be considerably magnified in privately operated facilities, including a lack of transparency and accountability and substandard or dangerous conditions of confinement.
Figure 5 shows that while for-profit companies operated only about 10 percent of the facilities, about 67 percent of individuals (including juveniles) were detained at least once in a privately operated facility. This is attributable to the relatively large capacity of privately operated facilities. For example, during fiscal year 2015, non-privately operated facilities each held on average 500 detainees, whereas privately operated facilities each held on average 5,581 detainees.
Another prominent feature of the current U.S. detention system relates to the location—or more precisely, the relative remoteness—of many of the detention facilities. Remoteness is of concern because confinement in remote locations that are outside of and distant from urban areas can separate detainees from their families, and community and legal support networks that may be critical to their well-being and chances of achieving favorable case outcomes. Figure 6 shows that about 50 percent of all facilities were located outside of major urban areas, and about 64 percent of all individuals (including juveniles) were detained at least once in facilities located outside of major urban areas.
Figure 6. Location of Facilities Used by ICE, Fiscal Year 2015
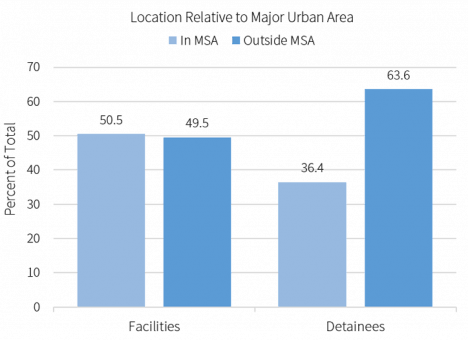
Note: A metropolitan statistical area (MSA) is an urbanized area that has a population of at least 50,000. We treat detention facilities located outside of the largest cities of MSAs as outside of major urban areas (Outside MSA).
Source: Authors’ original analysis of Geocoded Data.
In addition, we found that about 58 percent of individuals were detained at least once in a facility that was more than 30 miles away (in terms of driving distance) from the nearest nonprofit immigration attorney who practiced removal defense. A large proportion of detainees were confined in facilities that were even further away. For example, about 48 percent, 26 percent, and 22 percent of detainees were confined at least once in a facility that was located more than 60 miles, 90 miles, and 120 miles away, respectively, from the nearest nonprofit immigration attorney who practiced removal defense. Taken together, these results indicate that many detainees were held in locations that were relatively far from basic community structures and legal-services networks.