What Were the Outcomes of Detention?

By Emily Ryo, J.D., Ph.D. and Ian Peacock, M.A.
What Were the Outcomes of Detention?
To understand what happened to individuals once detained, we examined the following key detention outcomes: the number and type of transfers between facilities during detention, detention length, and the number and type of facility-related grievances. Our detention outcome analysis primarily focuses on adult detainees (N=296,703) given that a different set of legal requirements applies for the detention of juveniles.
Defining Transfers
For each detainee in the Detention Data, ICE generated a new detention record each time the individual was booked into a facility. In addition, ICE assigned each such record a release reason to indicate what had happened to the detainee at the end of the detention stint corresponding to each book-in. We treat a movement as a transfer if a given record has the release reason of “transferred” or “U.S. Marshals or other agency.”
We refer to these movements as interfacility transfers for the following reason: each facility in the Detention Data has a code assigned by ICE that is supposed to uniquely identify each facility. During our data cleaning, we ensured that for any given detainee with multiple detention records, each of his or her consecutive detention records had different facility codes. In effect, all of the transfers that we analyze in this study involved movements from one location to another location with distinct facility codes.
A majority of adult detainees experienced transfers, many of which involved movement across different cities, states, or federal judicial circuits.
The government has interpreted the law as providing the Attorney General broad discretion to transfer detainees. Accordingly, ICE has detained individuals where they were first taken into custody or transferred them to remote and distant facilities, including ones that are outside the jurisdiction of the presiding immigration court.
Transfers during detention can negatively impact detainees and their legal cases in a number of ways. For example, transfers may sever the detainees’ familial and social contacts, disrupt the continuity of their medical care and legal representation, and interfere with their efforts to navigate the legal system more generally.
Figure 7 shows that among all adults who were released during fiscal year 2015 (261,020 individuals), 70,254 detainees (27 percent) experienced one transfer before their release, 39,296 detainees (15 percent) experienced two transfers before their release, and 32,577 detainees (12 percent) experienced three or more transfers before their release. In all, about 54 percent of released individuals experienced at least one transfer during their detention.
Figure 7. Number of Detention Facility Transfers among Adults Released in Fiscal Year 2015
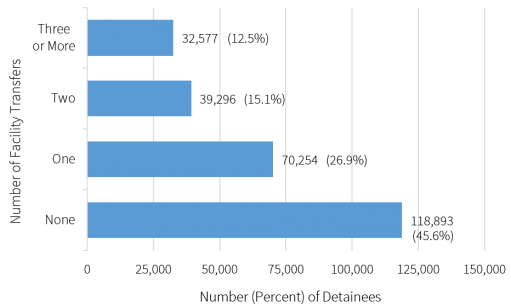
Source: Authors’ original analysis of Detention Data.
It is also helpful to consider the types of transfers that the detainees experienced, because different types of transfers may impose different types of challenges for the detainees, as we discuss below. We coded the transfers into three broad categories: intercity, interstate, and intercircuit. Intercity transfers are transfers between detention facilities that are located in two different cities (within the same state or across different states). To understand the extent to which these intercity transfers involved movements across different states, we also examined interstate transfers, which refer to transfers between two different states. Intercircuit transfers refer to transfers between two different federal judicial circuits, including the D.C. circuit.
Intercircuit transfers are of special concern, as such transfers can result in changes in the law governing the detainees’ immigration cases. In some instances, an intercircuit transfer can dramatically alter the outcome of a case and increase the likelihood of deportation without due process, because some federal district courts are less willing to issue a stay of deportation while the case is being appealed.
Table 2 shows that 177,402 out of 296,703 adults who were detained by ICE in fiscal year 2015 (60 percent) experienced at least one transfer. Among these 177,402 adults, about 86 percent experienced at least one intercity transfer, about 37 percent experienced at least one interstate transfer, and about 29 percent experienced at least one intercircuit transfer. Table 2 also shows that among 353,704 total transfers experienced by 177,402 adults, about 89 percent of the transfers were intercity transfers, about 28 percent were interstate transfers, and about 19 percent were intercircuit transfers.
Table 2. Type of Transfers for Detained Adults with at Least One Transfer, Fiscal Year 2015
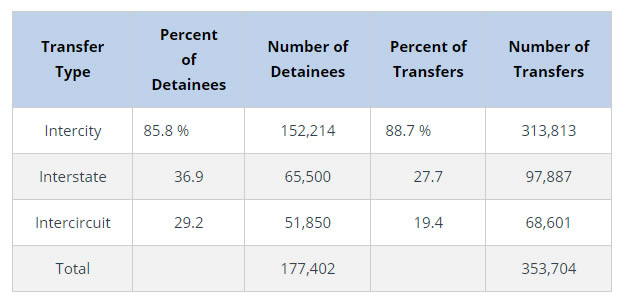
Source: Authors’ original analysis of Detention Data and Geocoded Data.
Another way of examining the transfers is to consider the average distance (mean) involved in different types of transfers. Figure 8 shows that intercircuit transfers involved the longest distance, an average of about 820 miles. Intercity transfers involved the shortest driving distance, an average of about 297 miles. Across all types of transfers, the average distance traveled was about 270 miles.
Figure 8. Average Driving Distance of Transfers among Detained Adults, Fiscal Year 2015
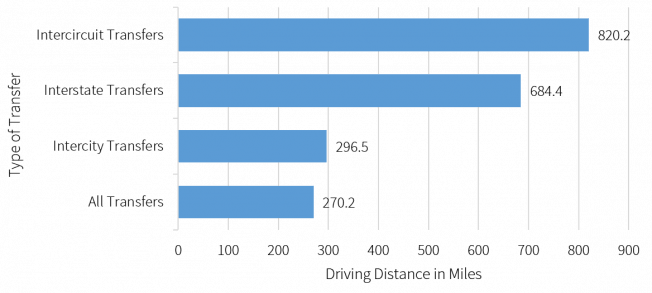
Source: Authors’ original analysis of Geocoded Data.
The policy directive issued by ICE in 2012 enumerates a series of officially-sanctioned reasons for transfers, including reasons related to “medical or mental health care to the detainee” and the “safety and security of the detainee, other detainees, detention personnel or any ICE employee.” Advocates and researchers, however, have reported a variety of other reasons for transfers, including retaliation against detainees for speaking up or organizing. To our knowledge, ICE does not maintain electronic records of why any given detainee is transferred, nor how ICE’s placement and transfer policies work in practice on the ground. Yet the basic patterns of transfers that we have described here underscore the critical need for the government to collect and to make publicly available precisely such information as a first step toward reducing transfers and mitigating their associated harms.
Defining Release from Detention
In examining detention length, we conducted separate analyses for the individuals who were removed, granted relief , or temporarily released . This subgroup analysis approach reduces the risk that our findings might be confounded by fundamental dissimilarities across individuals who experienced different types of releases.
The removed category includes individuals who were removed to their countries of origin. The granted relief category includes individuals whose recorded release reason was “Proceedings Terminated,” “Deferred Action for Childhood Arrivals,” “Deferred Action for Parents of Americans and Lawfully Admitted Residents,” or “Prosecutorial Discretion.” The granted relief category includes individuals who won their claims for relief from removal, such as asylum, adjustment of status, and cancellation of removal. The temporarily released category includes individuals whose recorded release reason was “Alternatives to Detention,” “Bonded Out,” “Order of Recognizance,” or “Order of Supervision.” In short, the temporarily released category includes individuals who were released so that they could await the completion of their removal proceedings on the outside.
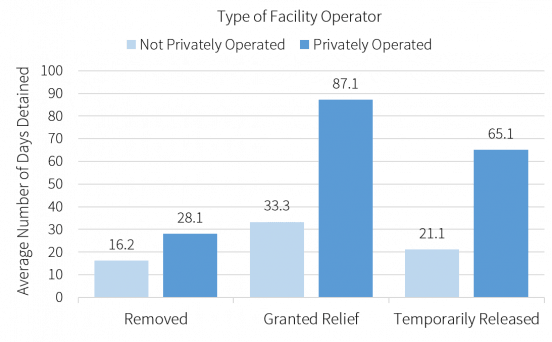
Among adult detainees, detention length was significantly longer in privately operated facilities and in remotely located facilities.
The second key outcome we examine is detention length. Figure 9 shows that about 17 percent of adult detainees released in fiscal year 2015 were released on the same day as their initial book-in. But many—about one-third of the population—were detained for more than 30 days. The average length of detention (mean) was about 38 days. The longest detention length among adults who were released in fiscal year 2015 was 2,943 days, indicating that one person was detained for over eight years. This detainee was not alone in experiencing years of detention. For example, 1,800 adults who were released in fiscal year 2015 were detained between 1 to 2 years; another 273 adults were detained between 2-3 years, and 117 adults were detained more than 3 years, before being released in fiscal year 2015.
Figure 9. Total Days Detained among Adults Released in Fiscal Year 2015
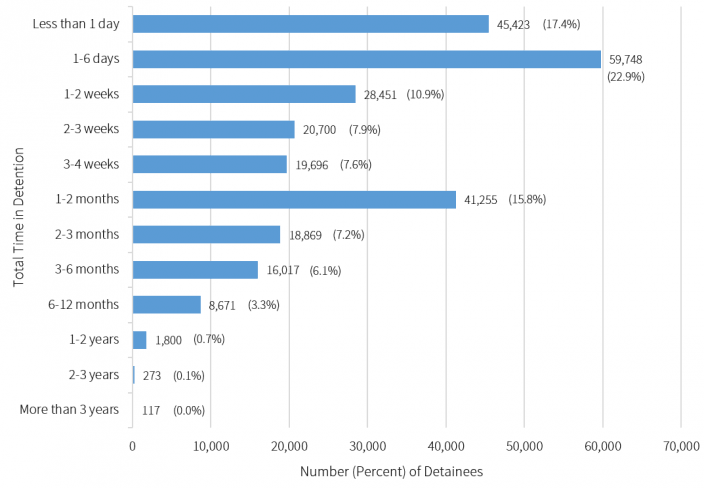
Source: Authors’ original analysis of Detention Data.
Did detention lengths vary by type of facility operators and facility locations? Figure 10 shows that across all major release categories, the average detention length was consistently and substantially longer in privately operated facilities than in non-privately operated facilities. Figure 11 shows that across all major release categories, the average detention length was consistently and substantially longer in facilities located outside of major urban areas compared to facilities located within major urban areas.
Figure 10. Average Days Detained among Adults by Type of Operation, Fiscal Year 2015
Source: Authors’ original analysis of Detention Data.
Figure 11. Average Days Detained among Adults by Facility Location, Fiscal Year 2015
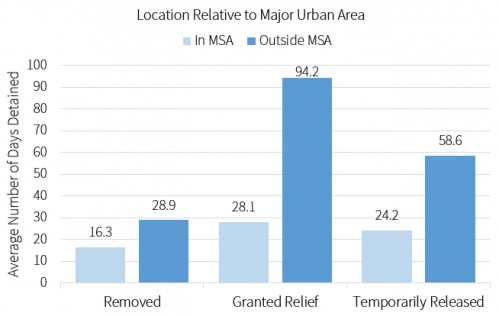
Note: A metropolitan statistical area (MSA) is an urbanized area that has a population of at least 50,000. We treat detention facilities located outside of the largest cities of MSAs as outside of major urban areas (Outside MSA).
Source: Authors’ original analysis of Detention Data.
We tested the robustness of these findings by analyzing detention length while controlling for a variety of individual and contextual factors, including gender, region of origin, age, legal status at the time of last U.S. entry, and criminal history, count of transfers, miles to nearest nonprofit immigration attorney, as well as the regional location of facilities. Our regression analysis results are consistent with the patterns presented in Figures 10 and 11. For example, among those who were removed, confinement in a privately operated facility was associated with an 82 percent increase in detention length. The same is true of confinement in facilities located outside of major urban areas, which was also associated with an 82 percent increase in detention length.
Why might detention length be longer in privately operated facilities and facilities located outside major urban areas? Data scarcity prevents us from empirically addressing this question. However, a number of potential explanations are worth considering. First, ICE may be systematically identifying and placing detainees who are likely to be detained longer into these types of facilities.
Second, privately operated facilities and facilities located outside of major urban areas tend to detain a substantially higher number of individuals on average. Geographical concentrations of large detainee populations are likely associated with longer court backlogs, and in turn, longer time to release, all else being equal.
Third, certain conditions of confinement in privately operated facilities and facilities located outside of major urban areas may be systematically linked to longer detention. For example, insofar as telephone calls are more expensive in privately operated facilities, or visitation is more difficult in facilities located outside of major urban areas, detainees may face greater challenges in obtaining legal counsel or obtaining materials necessary for their court hearings. If so, we might expect detainees in such facilities to seek court continuances at higher rates, leading to longer detention.
In sum, our findings raise important questions about whether certain structural conditions in privately operated facilities and in remotely located facilities may produce longer detention lengths.
The number of grievances was significantly higher in privately operated facilities and in remotely located facilities.
The conditions of confinement in detention have generated concern and litigation across many different facilities. Examining the types and prevalence of grievances that detainees and community members filed against detention facilities provides one insight into the conditions of confinement. The grievances that we examine here were captured through calls that the ICE Enforcement and Removal Operations’ Detention Reporting and Information Line (DRIL) received from detainees and community members in fiscal year 2015.
It is important to note that DRIL is only one mechanism through which detainees and community members can report grievances related to detention facilities. Nonetheless, the Grievance Data is an important source of information on grievances given that detainees may be more likely to be aware of its existence than other reporting mechanisms.
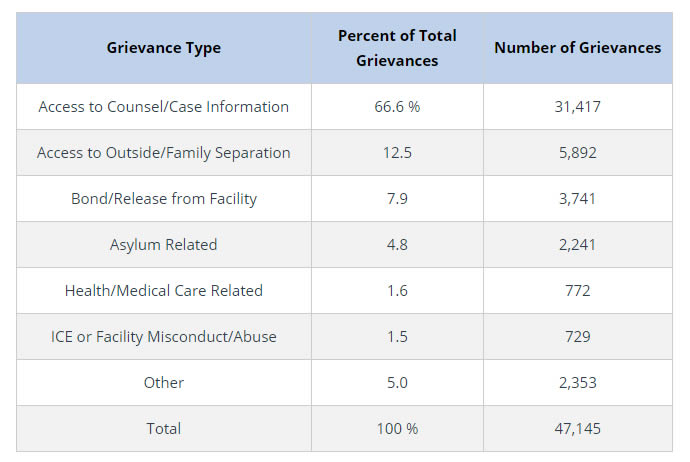
The original data relating to grievances that Human Rights Watch received from ICE contained a total of 48,849 grievances pertaining to specific detention facilities. Matching these facilities to the facilities in the Detention Data and restricting the sample to only those facilities used by ICE in fiscal year 2015 produced an analysis sample of 47,145 grievances pertaining to 304 facilities. We consolidated 18 different grievance categories as reported by ICE into seven broad grievance types, as shown in Table 3.
Table 3. Number and Types of Grievances, Fiscal Year 2015
Source: Authors’ original analysis of Grievance Data.
The majority of the grievances involved issues relating to access to legal counsel and basic immigration case information—a total of 31,417 grievances constituting 67 percent of all grievances. We also found a high prevalence of grievances relating to access to the outside and family separation issues. This grievance type includes the following categories of grievances as reported by ICE: “Online Detainee Locator, “Telephone Access,” “Visitation,” and “Separation from Minor Child or Other Dependent or Parental Related.”
Next, we examined whether the number of grievances varied by the type of facility operator and facility location. Figure 12 shows that a substantially higher number of grievances on average (mean) were filed against privately operated facilities and facilities located outside of major urban areas.
Figure 12. Average Number of Grievances by Type of Operation and Facility Location, Fiscal Year 2015
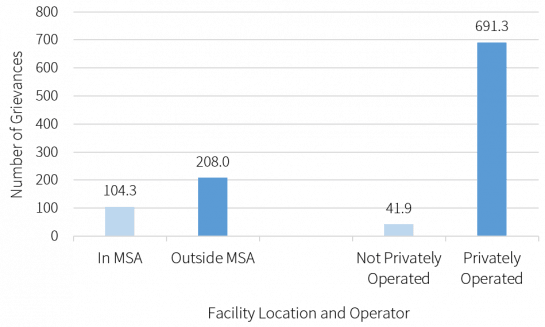
Note: A metropolitan statistical area (MSA) is an urbanized area that has a population of at least 50,000. We treat detention facilities located outside of the largest cities of MSAs as outside of major urban areas (Outside MSA).
Source: Authors’ original analysis of Grievance Data.
To assess the robustness of these results, we conducted a regression analysis of grievances that controls for other possible determinants of grievances. These control variables include (1) proportion male (the proportion of detainees confined in any given facility during fiscal year 2015 who were male); (2) proportion Mexican (the proportion of detainees confined in any given facility during fiscal year 2015 who were of Mexican origin); (3) total detainee population (the total number of detainees confined in a given facility during fiscal year 2015); (4) average detention length (the average number of days detained in any given facility in fiscal year 2015; and (5) whether or not the facility was a juvenile facility.
The results of this regression analysis are consistent with our findings shown in Figure 12. In short, we find that privately operated facilities are expected to have about 175 percent more grievances than non-privately operated facilities, controlling for the factors noted above. Facilities located outside of major urban areas are expected to have about 51 percent more grievances than facilities located inside major urban areas, all else being equal.
There is no evidence to suggest that it is easier to submit grievances in privately operated facilities and in remotely located facilities. On the contrary, existing research suggests that the opposite is likely true. For example, reports suggest that privately operated facilities are more likely to lack transparency and public accountability. It is also important to note that our findings are consistent with the findings resulting from investigations of correctional facilities in the criminal justice system. These investigations revealed that privately operated prisons had a worse record on most safety and security measures relative to comparable facilities operated by the Federal Bureau of Prisons.